
Fleet Set Up
The elastic stack uses fleet to manage agents and integrations, usually this is done via interaction with elastic.co. In an air gapped environment, we must host the agent binaries and EPR ourselves.
Elastic Package Registry
In Part 1, we downloaded the EPR docker image, saved it and transferred the tar file to the Kibana server.
Load the docker image to the Kibana server:
docker load -i package-registry-X.X.X.tarRun the image, binding it to port 8080 on localhost:
docker run -d -it -p 127.0.0.1:8080:8080/tcp docker.elastic.co/package-registry/distribution:X.X.XCheck status with:
docker psUpdate kibana.yml to specify the location of the self-hosted package registry and add Air Gapped settings:
xpack.fleet.isAirGapped: true
xpack.fleet.registryUrl: “http://127.0.0.1:8080”
Restart the Kibana service:
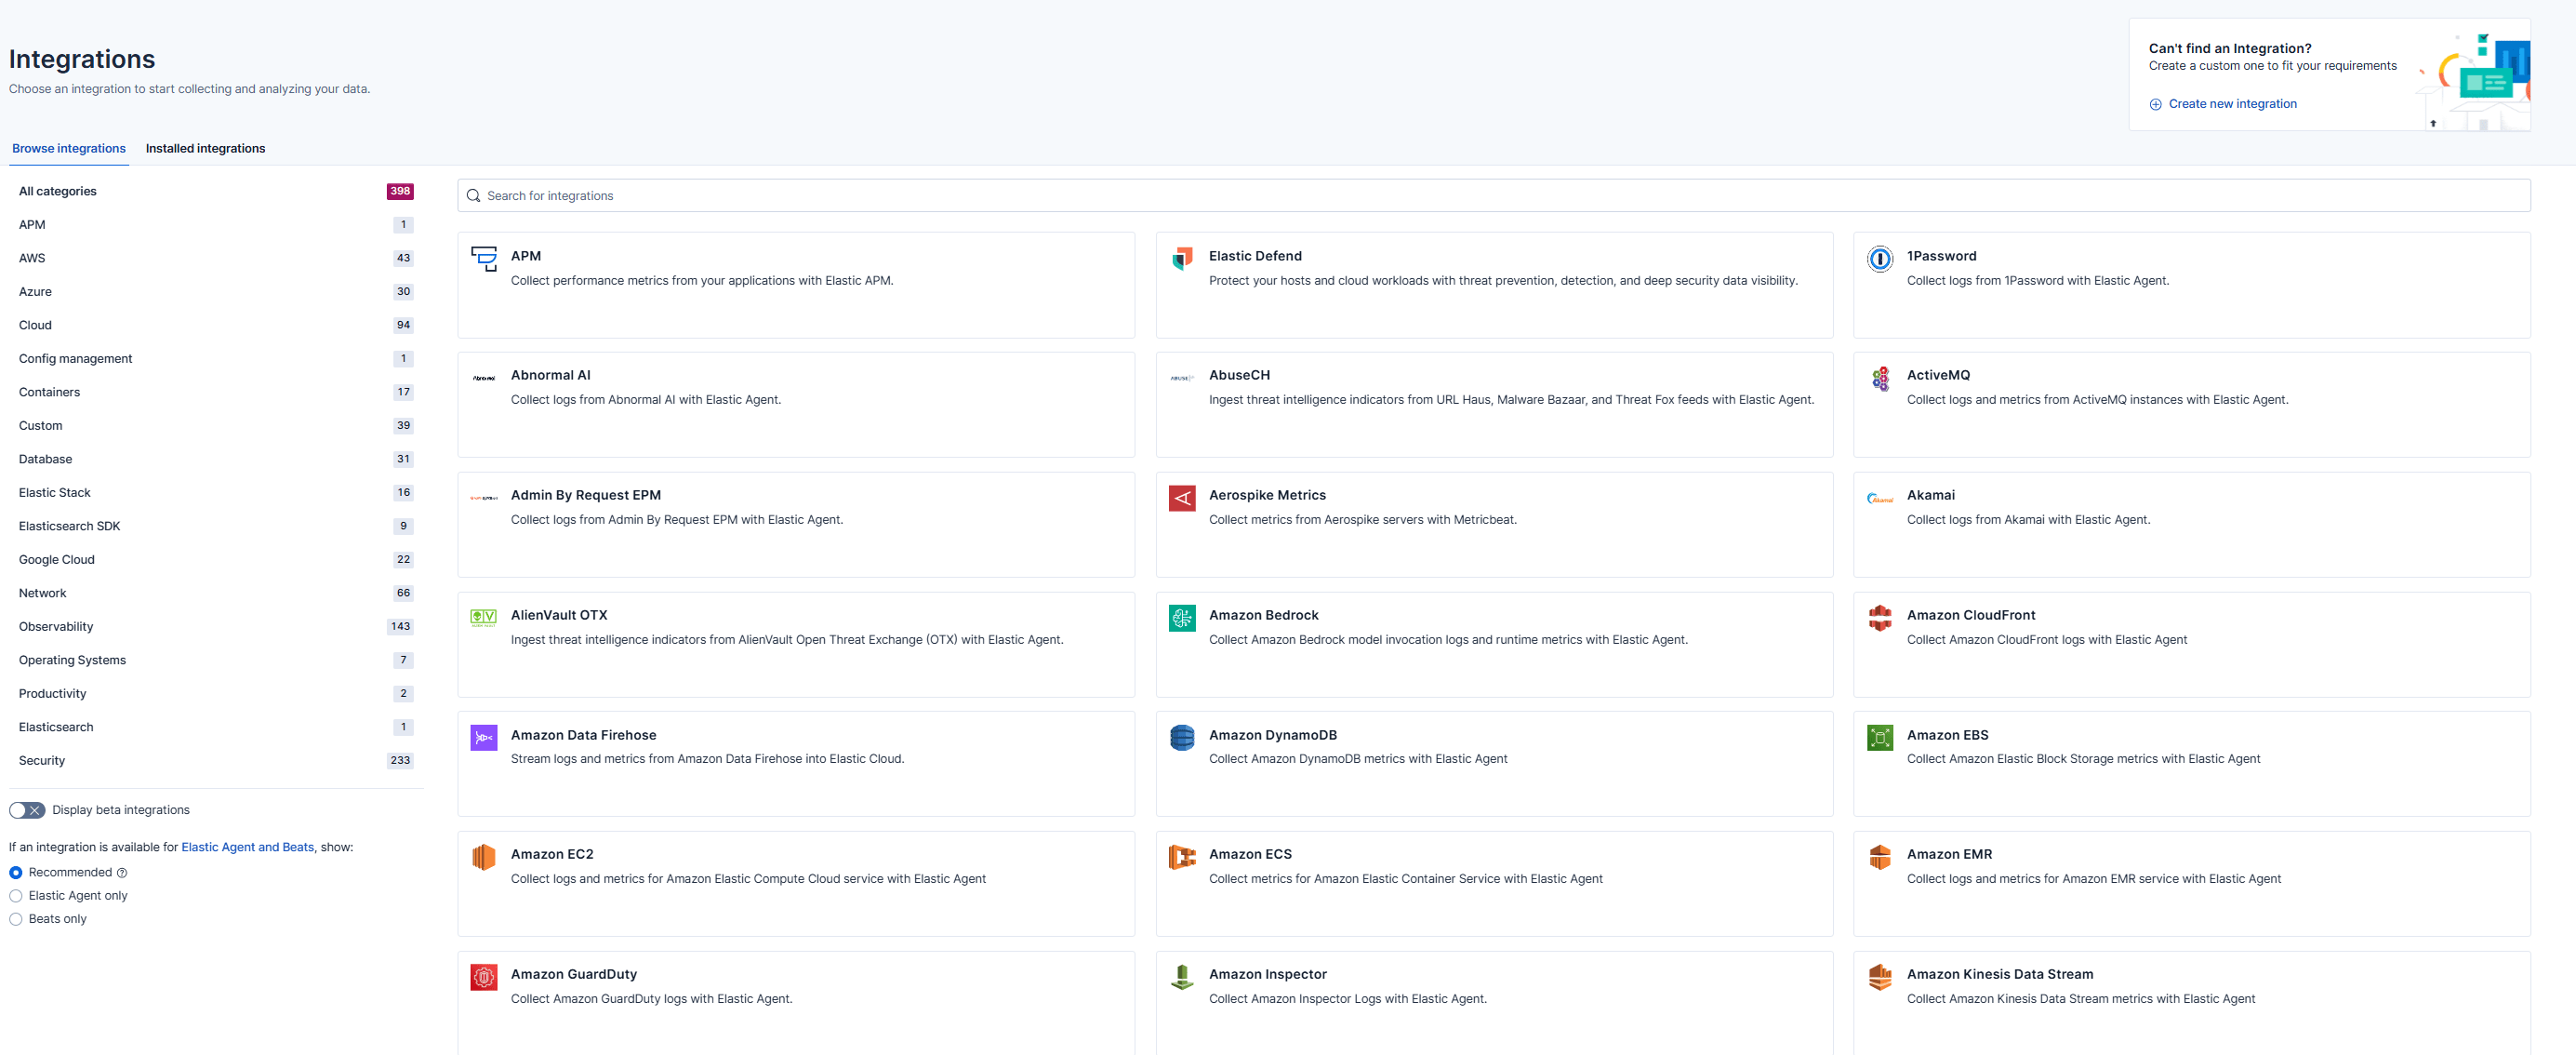
sudo systemctl restart kibanaIn the Kibana UI, navigate to Integrations to check the EPR is running properly.
Agent Binaries HTTP server
If you are using a preexisting repo and you have moved the agent files in there, skip the next step and head straight to Fleet Settings
Navigate to the directory that you copied the agent binaries to and start an HTTP server using python.
python3 –m http.server 8081Fleet Settings
We need to reference the agent binary location in Fleet.
Navigate to Fleet > Settings

Under Agent Binary Download select Add agent binary source
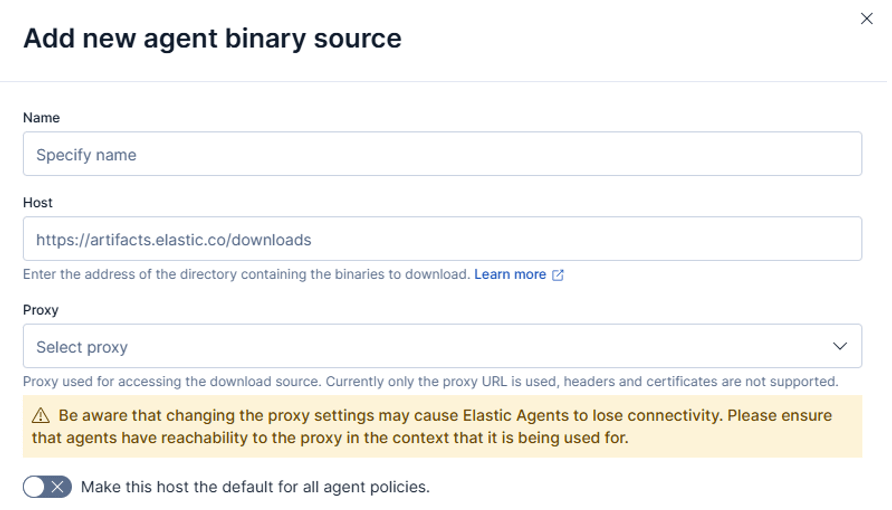
Choose a name for the new source e.g. Local repo
Under host, specify the location of agent binaries. The following example uses the HTTP server from the previous step. If you are using your own repo, specify the directory above the agent binaries.
http://<your-kibana-ip>:8081
Add Fleet Server
There are a variety of places you can install the fleet server. If you are just using one server to host Elastic and Kibana without much demand, it’s fine to install it on the same server. This is the approach I will be taking for this blog post.
If you are planning on enrolling many agents, you can install it on a dedicated server, or co-locate it with Logstash if that’s the set up you go for, any configuration is acceptable if it suits your use case. All agents must be able to communicate with the fleet server on port 8220 (unless another port is specified).
Navigate to Fleet and select Add Fleet Server
For the purpose of this guide, we will be setting fleet up with quick start, if you are using your own certs and in a production environment, this is not suitable, and you should consult the elastic documentation.
Choose a name e.g. Fleet Server
Under host, enter the URL of the intended Fleet Server:
https://<your-fleet-server-ip>:8220

Create the fleet server policy and choose the appropriate distribution, Linux Tar is recommended as it’s easier to upgrade via fleet:
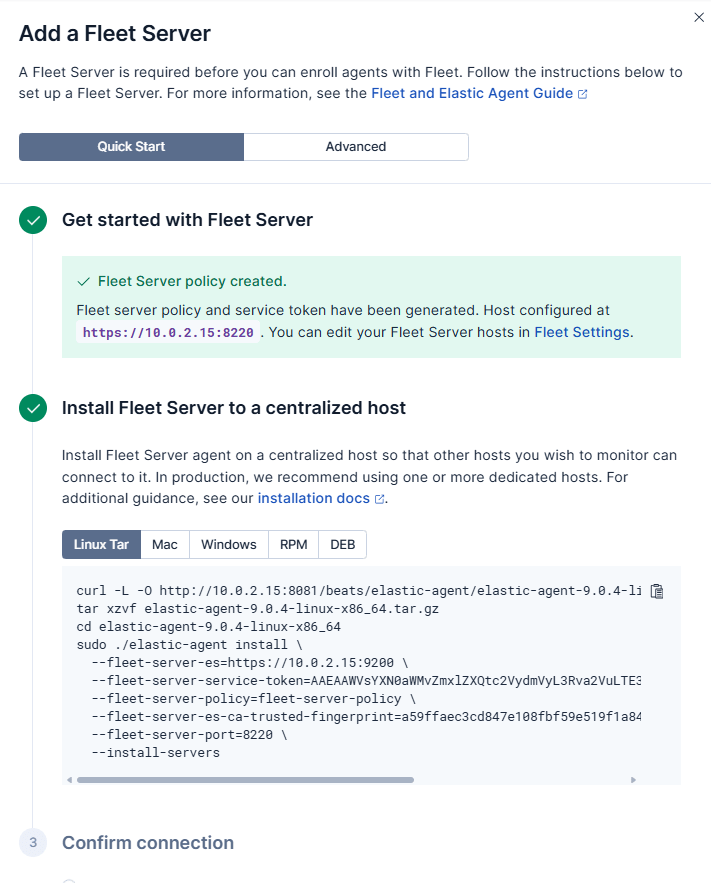
Copy the script and run it on the desired host. This will enrol the fleet server. Ensure the fleet server is healthy under agents, we will add more agents.
Set up encryption key
If you don’t specify an encryption key, Kibana might disable features that rely on encrypted saved objects.
Add the following config to the end of the kibana.yml file:
xpack.encryptedSavedObjects:
  encryptionKey: "min-32-byte-long-strong-encryption-key"
Restart the kibana service
sudo systemctl restart kibanaConclusion
The next (optional) part of this series focusses on integrating Logstash in the fleet set up. If that’s not something you require then that concludes this series of blog posts! I hope you’ve enjoyed following along.
In the next series, titled “Data Ingestion Using the Elastic Stack”, we will cover: adding out of the box integrations, custom integrations, ingest pipelines and processors.